Cockpit
The default landing page after login. One glance to take stock of the organisation's exposure, the recent activity per scope, and the state of the monitors.
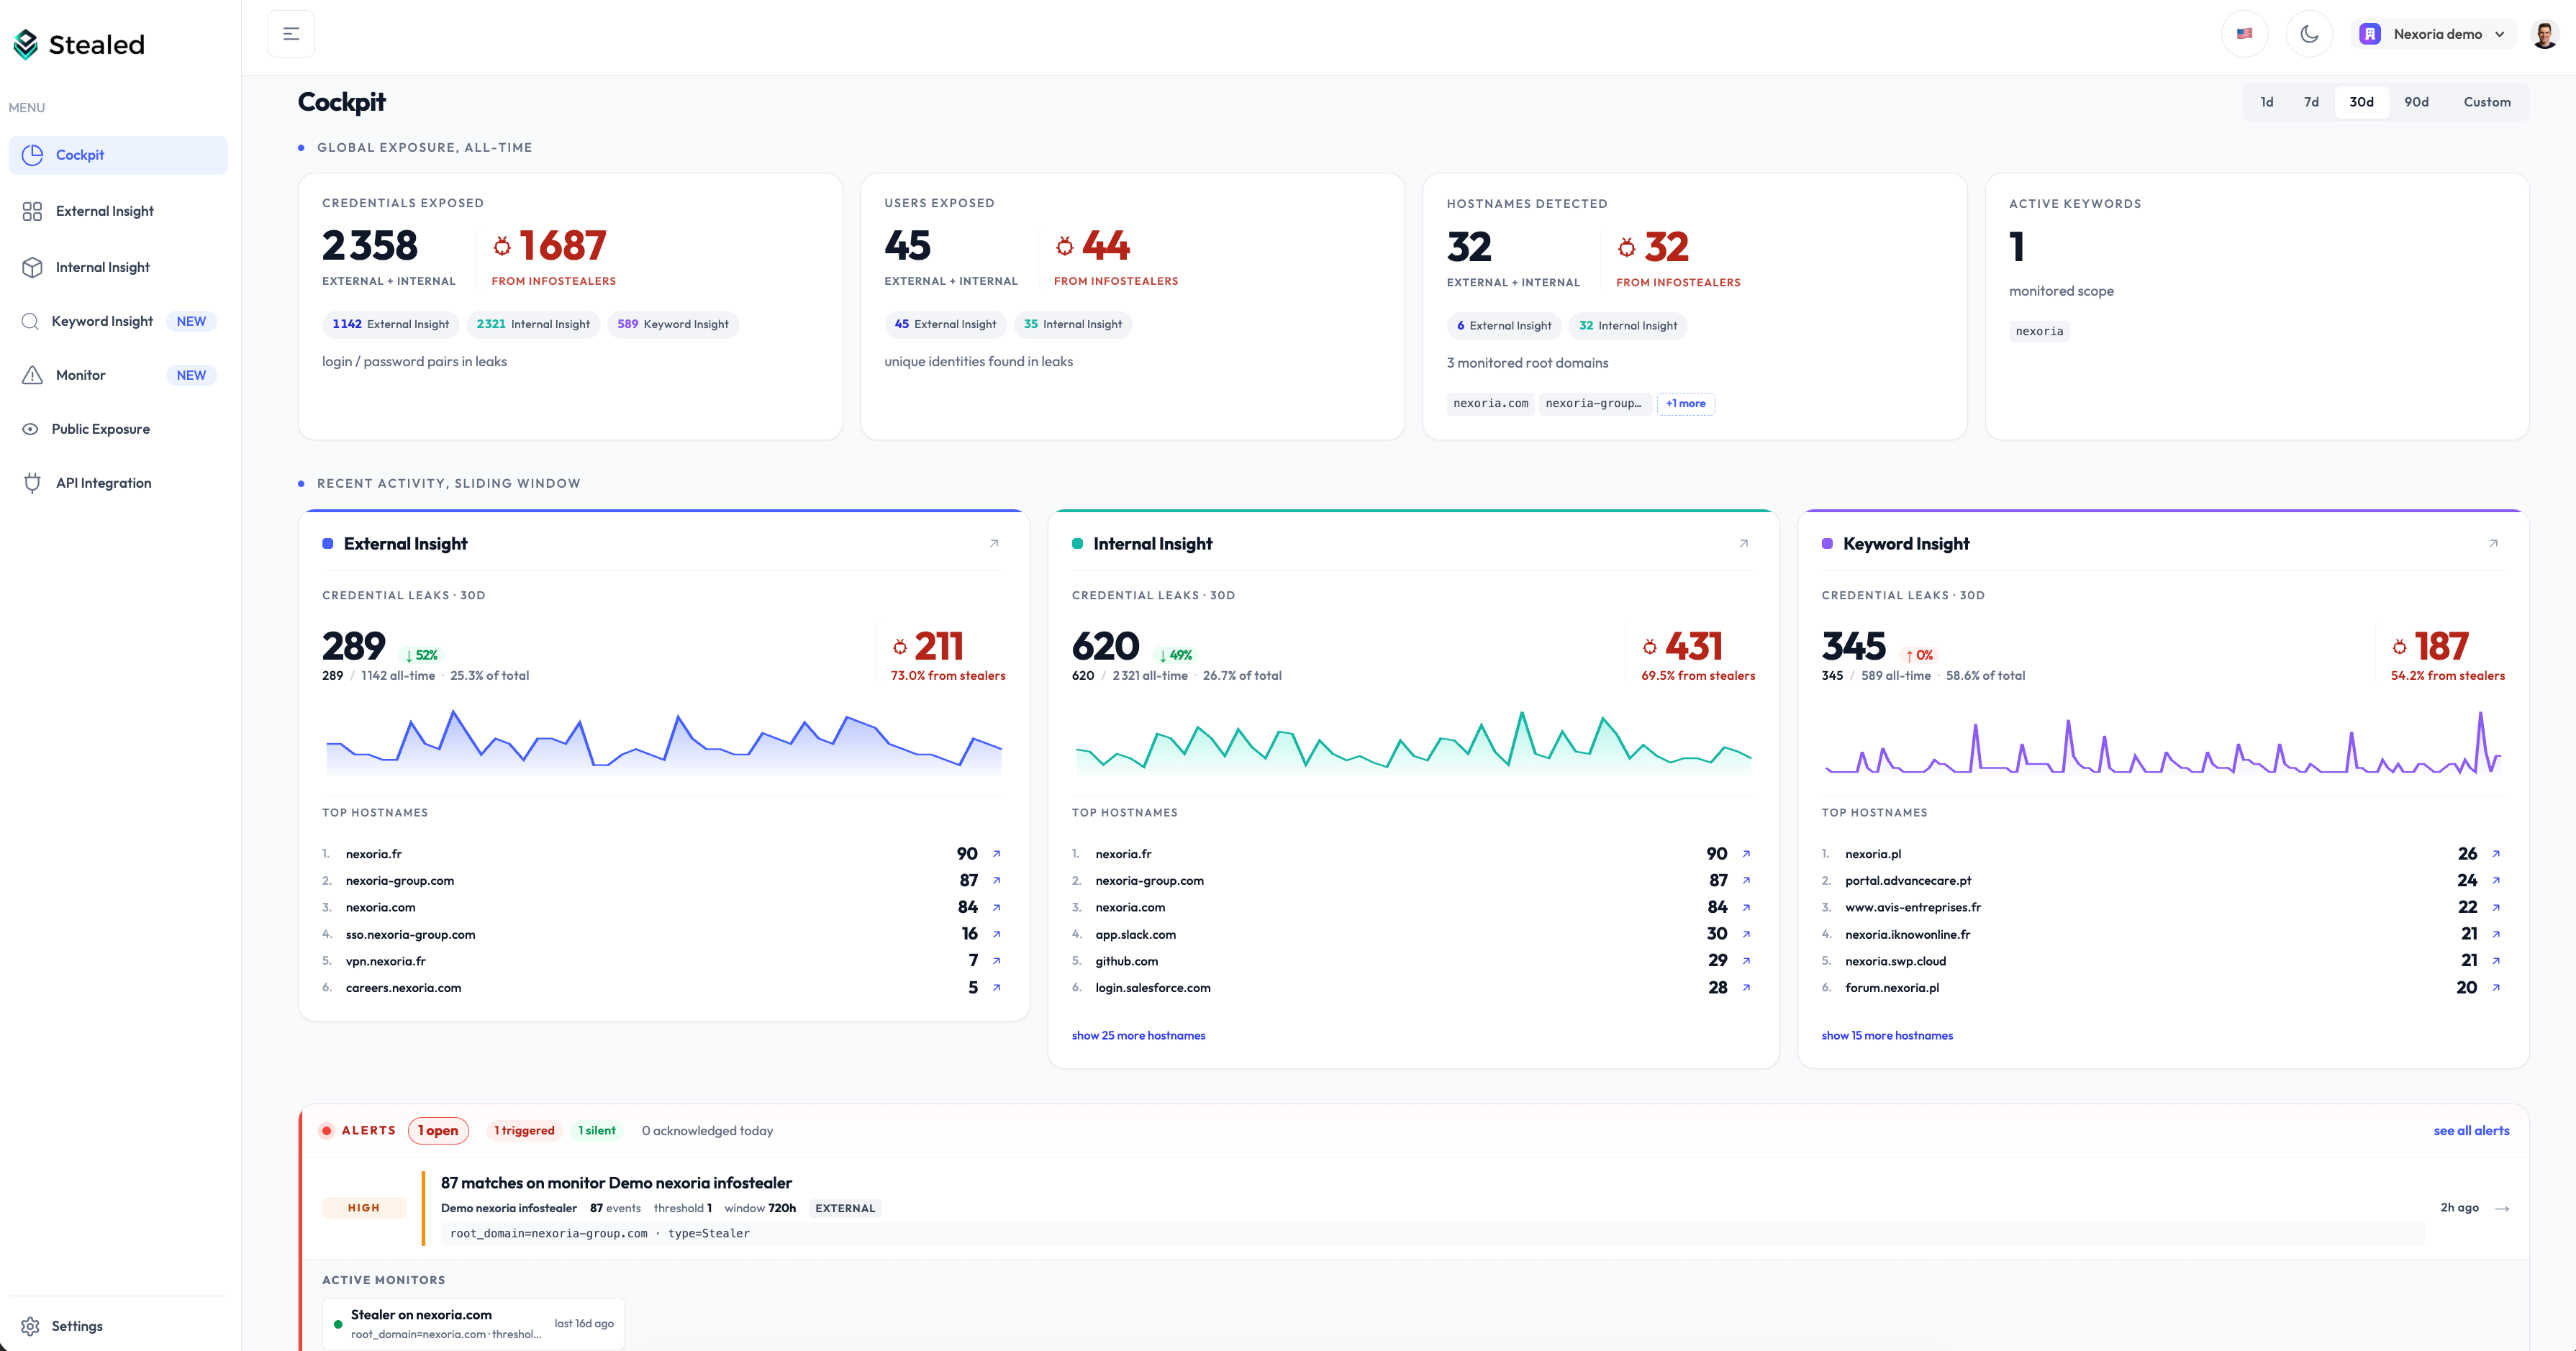
The Cockpit at /cockpit is the default landing page after you sign in. One page, three sections stacked top to bottom, designed to answer "how exposed are we today, and what changed?" at a glance.
The Cockpit is not a replacement for the specialised Insight pages. It is a recap layer above them. Every KPI, chip and Top-N item is clickable and either opens a side drawer with the underlying leaks, or drills into the matching Insight page pre-filtered.
Period selector
A tab bar at the top of the page: 1d, 7d, 30d, 90d, Custom. Default is 30d. It only affects the Recent Activity section. Global Exposure is always all-time; the Alerts section reflects live monitor state.
Global Exposure (all-time)
Four KPI cards across the top, all-time totals:
- Credentials exposed, distinct login / password pairs across the three scopes, hash-deduplicated.
- Users exposed, distinct email addresses (External + Internal).
- Hostnames detected, distinct domains observed in leaks, with the count of your monitored root domains alongside.
- Active keywords, monitored scope.
The Credentials, Users and Hostnames cards split per scope (External / Internal, plus Keyword for Credentials) and expose a from infostealers chip that counts only infostealer-sourced leaks, side by side with the combo total. Clicking the headline opens the underlying leak list in a drawer. Clicking a chip opens the same drawer restricted to that source.
Recent Activity (period)
Three columns, one per scope. Every value here is scoped to the period you selected.
- External Insight, new credentials on your monitored domains during the period.
- Internal Insight, new credentials on your employees during the period.
- Keyword Insight, new keyword matches during the period.
Each column shows the period total, a trend pill vs the previous equivalent window, a from stealers count, the share of the scope's all-time exposure, a sparkline, and a Top hostnames list. Clicking a hostname routes to the matching Insight page pre-filtered.
Alerts and Active Monitors
At the bottom of the page, mixing live monitor state and triggered events:
- Status pills:
open,triggered,silent,snoozed,acknowledged today. - List of triggered alert events, severity-tagged. A click opens the Event detail drawer in place (assign, acknowledge, comment, close, mute).
- Volumetric anomaly row when the leak volume over a short recent window significantly exceeds the median of the last 30 days. Clicking it opens External Insight scoped to the spike window.
- An Active monitors grid below: enabled monitors not currently triggered, plus snoozed ones.
The section is hidden entirely when there are no events and no enabled monitors.
Empty states
- No monitored domain: the Cockpit is replaced by the onboarding wizard.
- No keyword: the Keyword column still renders, with zeros.
- No monitor: the Alerts section is hidden.
What's next
- Insights overview, the three specialised pages the Cockpit summarises.
- Reading detected leaks, filters, table view, export.
- Create a monitor, turn any Insight into a real-time alerting rule whose events surface in the Cockpit's alerts section.